Exploring Grafana and InfluxDB
Most recently, I've been exploring using Grafana and InfluxDB as a way to aggregate metrics in one happy place. It's also useful that Grafana has some downloadable dashboards for some existing software, and making new dashboards is as easy as writing some queries and adding it to an existing visualization.It's also got a handy alert system... what more could you want?
Setting up Grafana and InfluxDB wasn't too hard. The documentation is very useful and to setup a test instance was easy. I would have preferred using a docker instance, but since I needed it able to connect to things in my company's network, had to place it on some old Windows Server 2012 R2 machine *ugh*. Luckily this wasn't much of an issue, and after the installation, was easily able to wire it up to an Octopus Deploy database with a premade dashboard specifically for Octopus and was instantly bombarded with stunning visuals and more information about my deployments than I could have ever wanted (well - I did have to update all the queries because our database name did not match the one provided, but after a quick find/replace I was in business).
I started tinkering with it to get some neat insights - like - how many production releases fall outside our normal Wednesday release. How much time is the average deployment? I like this article on stackify about devops metrics - as a good starting point.
 This dashboard provided me with several points from this list, including Deployment Frequency, Deployment Size, Deployment time, and Failed deployments. We had another initiative going with our testers to get load/performance testing up to par, as well as considering replacing our monitoring company with an in-house solution. So we've done a bit of prototyping running our jmeter tests and reporting the output to InfluxDB, and similarly, we're using our octopus health checks (machine policies) - to gather data on disk usage, cpu/memory... with thoughts of expanding this to checking service and application pool states. Even played around with a postman collection run via newman with an InfluxDB reporter - some overlap with the jmeter tests, but we were using the postman collection as a smoke test, and we could pretty easily make these into ping tests with alerts now. Grafana and InfluxDB give us one nice place to dump all this info and generate useful reports. What's more is that the alert system can be tied into these reports, so for instance, if disk space goes over 80% we can be notified and make some decisions before it becomes a problem.
This quick prototype has been very useful, but there's a lot that will go into buliding out a great solution with these tools, such as maintenance on influx/grafana, who's allowed to use it, networking/firewall work to let machines talk to Influxdb, getting the alerts right so they don't generate a ton of noise, and even just collecting the right data and storing it the right way. But it's a great start.
While exploring Grafana/Influx, I noticed that there are existing dashboards for home automation - which might be a good topic for another post.
-R
Setting up Grafana and InfluxDB wasn't too hard. The documentation is very useful and to setup a test instance was easy. I would have preferred using a docker instance, but since I needed it able to connect to things in my company's network, had to place it on some old Windows Server 2012 R2 machine *ugh*. Luckily this wasn't much of an issue, and after the installation, was easily able to wire it up to an Octopus Deploy database with a premade dashboard specifically for Octopus and was instantly bombarded with stunning visuals and more information about my deployments than I could have ever wanted (well - I did have to update all the queries because our database name did not match the one provided, but after a quick find/replace I was in business).
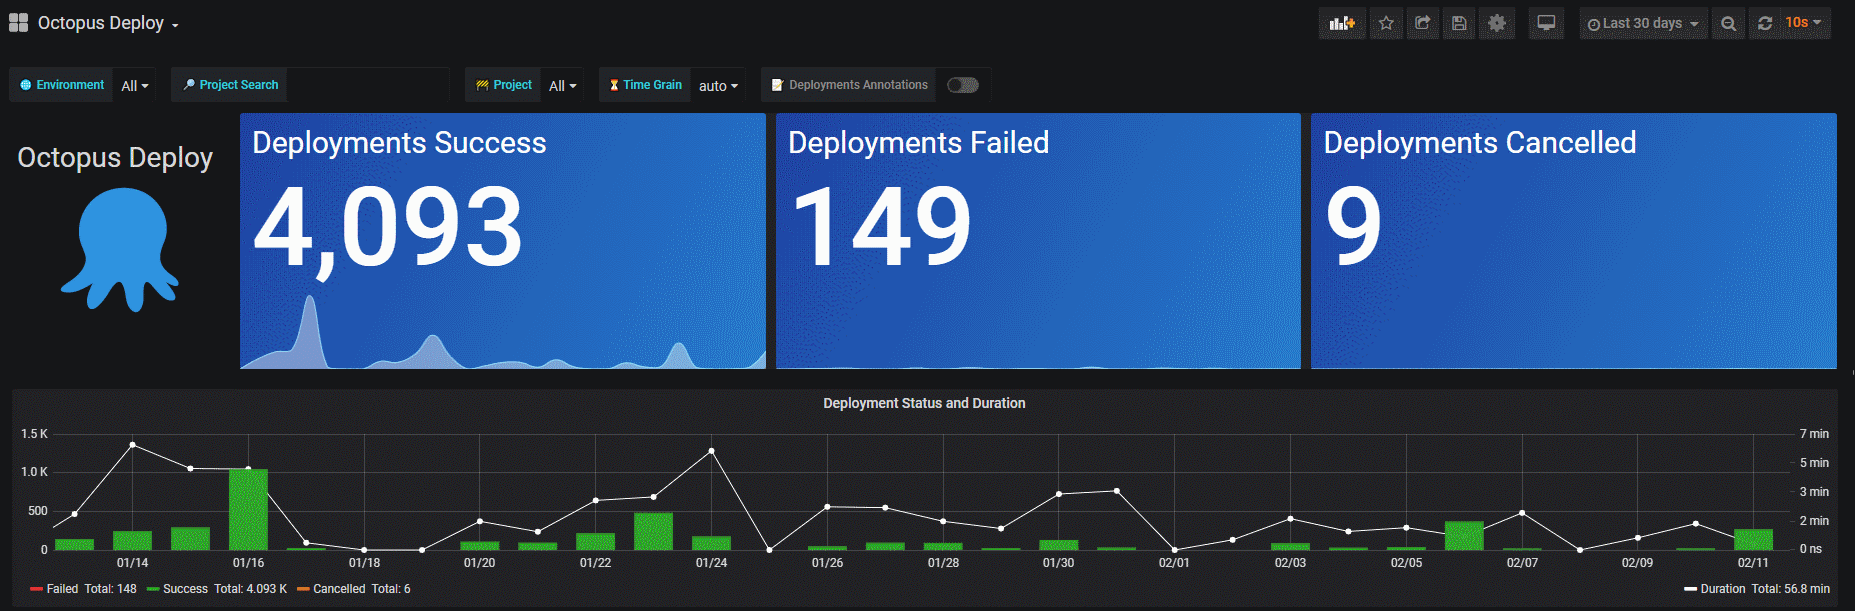 |
| Not my instance but a sample from the dashboard download page |

This quick prototype has been very useful, but there's a lot that will go into buliding out a great solution with these tools, such as maintenance on influx/grafana, who's allowed to use it, networking/firewall work to let machines talk to Influxdb, getting the alerts right so they don't generate a ton of noise, and even just collecting the right data and storing it the right way. But it's a great start.
While exploring Grafana/Influx, I noticed that there are existing dashboards for home automation - which might be a good topic for another post.
-R
Comments
Post a Comment